CPU, memory, disk, battery and network
Know what your Mac is doing.
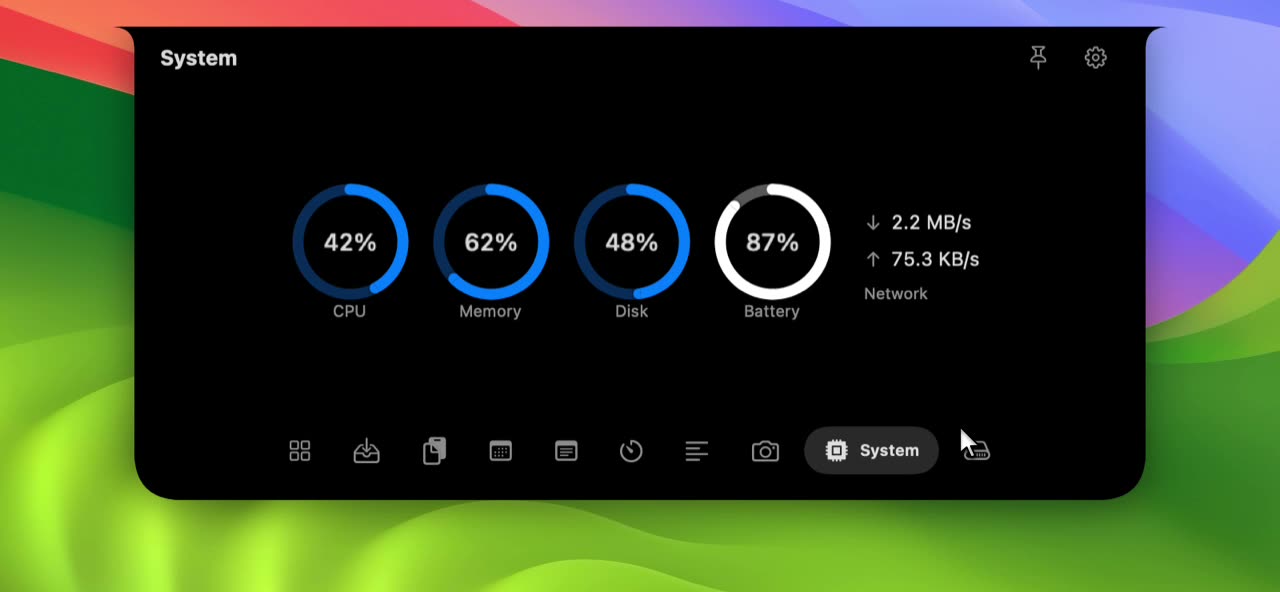
What it does.
- Five readings at a glance
- CPU, memory, disk and battery use native circular gauges, with network download and upload speed beside them.
- Colour that means something
- Usage turns orange then red as it climbs. Battery turns red when low and green while charging, so a full battery never looks like an alarm.
- Light on purpose
- Readings are sampled once a second, and only while this tab is on screen.
- Real network speed
- Speeds are measured from your WiFi and Ethernet interfaces, and virtual interfaces are left out so traffic is not counted twice.
Activity Monitor is great, but it is a window. These gauges give you the headline numbers for a glance.
What you see
Four rings (CPU, memory, disk and battery) and a small network readout. Everything updates live while the tab is open.
Good to know
- It shows totals only, with no per app or per process breakdown.
- Battery only appears on Macs that have one.
- The first network reading appears after the second sample, about one second in.
Questions about System Stats in Your Notch.
Does this slow my Mac down?
It reads a few system counters once a second while the tab is open and stops when it is not. The cost is very small.
Which network interfaces are counted?
WiFi and Ethernet. VPN tunnels and other virtual interfaces are excluded to avoid counting the same traffic twice.
How is memory usage calculated?
As active, wired and compressed memory against your Mac's total memory.
Pair it with.
- Timers
- Focus sessions without another window. See Timers
- Clipboard
- Everything you copied, one hover away. See Clipboard

Put your notch to work.
Download NotchStar, open your first tool in seconds, and decide after 7 days whether it earns $4.